Probably the most useful R function I’ve ever written

15 Aug 2016
2016/08/15

The function in question is scriptSearch. I’m not much for superlatives — “most” and “best” imply one dimension, but we live in a multi-dimensional world. I’m making an exception.

The statistic I have in mind for this use of “useful” is the waiting time between calls to the function divided by the human time saved by the call.

I wrote a version of this for a company where I do consulting. There are few days working there that I don’t have at least one bout with it.  Using scriptSearch can easily save half an hour compared to what I would have done prior to having the function.

Read more →

Source for the marketAgent R package

22 May 2016
2016/05/22

I recently gave a talk at the R in Finance conference in which I introduced the marketAgent package for R.

Here is the source for the package if you’d like to play with it: marketAgent_0.000.tar

I’ll be giving more details of the talk real soon now.


Update:  The Portfolio Probe website now has a blog post on the conference.  And here are the slides for my talk.

Review of ‘Advanced R’ by Hadley Wickham

24 May 2015
2015/05/24

Executive summary

Surprisingly good.

And it’s not like my expectations were especially low.

Structure

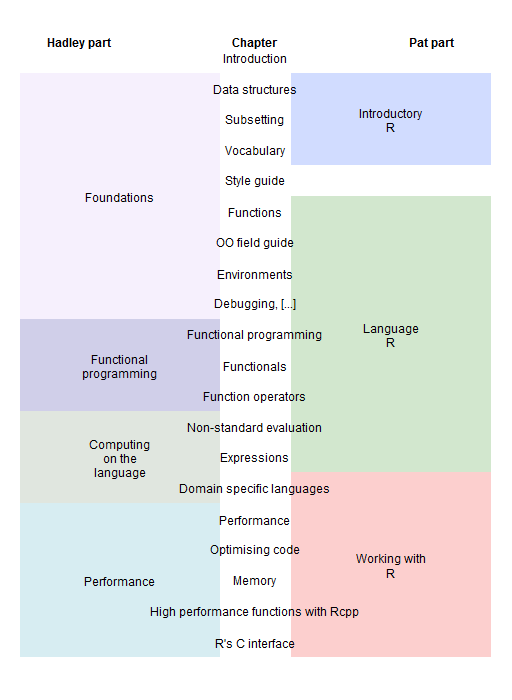
There are 20 chapters.  I mostly like the chapters and their order.

Hadley breaks the 20 chapters into 4 parts.  He’s wrong.  Figure 1 illustrates the correct way to formulate parts.

Figure 1: Chapters and Parts of Advanced R. advanced_R_table_of_contents


Read more →

The wings of a programmer

12 Apr 2015
2015/04/12

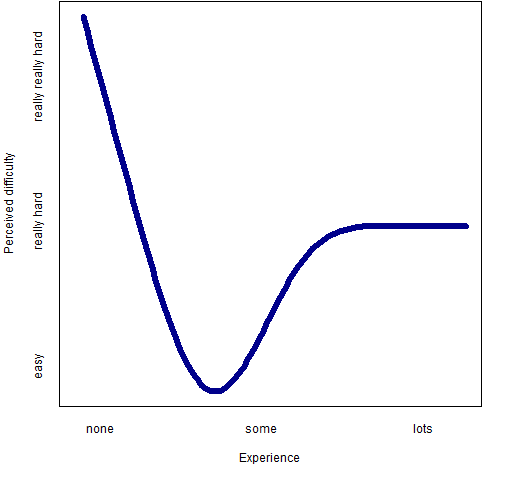
Programmers think programming is really hard.  Non-programmers think it’s even harder than that.

Figure 1: The perceived difficulty of programming. perceived_programming_difficulty

Why is programming so arduous? Read more →

An experience of EARL

02 Jan 2015
2015/01/02

Coordinates: 2014 September 15-17 in the London borough of #rstats.

15th, evening

I had just the right number of R bugs so that I could walk to the drinks and arrive fashionably late.  On the way, I realized that I hadn’t been near the Tower of London since the first year I moved to London even though I live within walking distance.

Once arriving and receiving my Mango the cat, I got into the mix.

Figure 1: Mango the cat with friend (courtesy of Andrie de Vries). norrpa_mango_20140915_235934

exciting

I was asked, “What do you think is new and exciting in R?” Read more →

21 R navigation tools

17 Aug 2014
2014/08/17

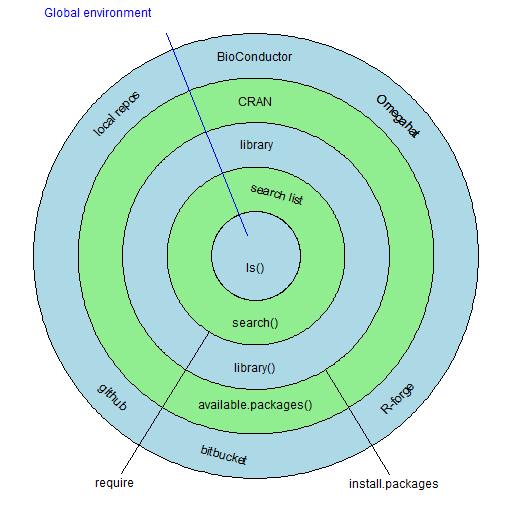
Navigation gets you from where you are to where you want to be.

Speaking of navigation, you can jump to selected sections of this post: Navigation; R-bloggers; Task views; Rdocumentation.org; sos package; ??; apropos; ls; methods; getAnywhere; :::; find; args; grep; %in%; str; getwd; file.choose; Spyglass summary; browser; See also.

Overview

Figure 1: A map of the R world. Rmap Each R session has a workspace specific to it. Ironically this is called the global environment.  You can see what objects are in it with the command: Read more →

The TaoTeProgramming R package

29 Jun 2014
2014/06/29

I’d like to do a song of great social and political import.

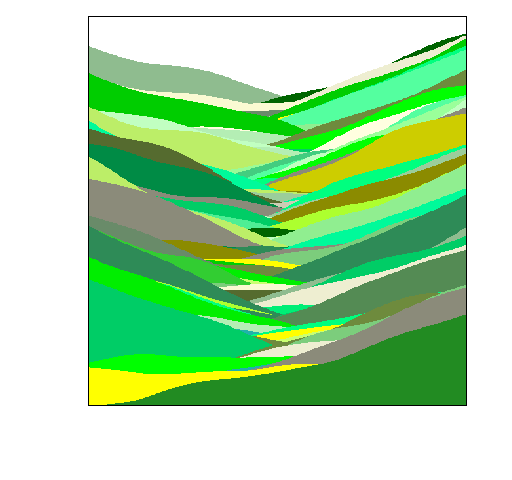
The code that created the illustrations in Tao Te Programming is now available as the TaoTeProgramming package on CRAN.

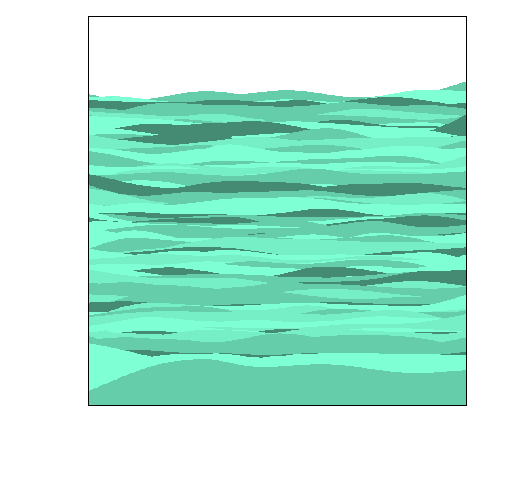
The sea is just flat hills

sea51hills5 And they are both just smooth mountains.

Read more →

An xts R Inferno-ism

07 Feb 2014
2014/02/07

Another of the all ye entering here.

Issue

When subscripting an xts object, columns that don’t exist in the object are silently ignored.

Example

First, create an xts object:

xtx <- xts(cbind(a=1:4, b=11:14, c=21:24), order=Sys.Date() + 1:4)

which looks like: Read more →

From spreadsheet thinking to R thinking

07 Jan 2014
2014/01/07

Towards the basic R mindset.

Previously

The post “A first step towards R from spreadsheets” provides an introduction to switching from spreadsheets to R.  It also includes a list of additional posts (like this one) on the transition.

Add two columns

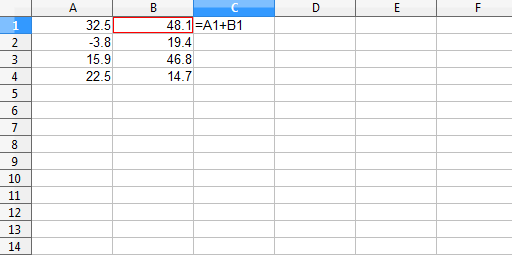
Figure 1 shows some numbers in two columns and the start of adding those two columns to each other in a third column.

Figure 1: Adding two columns in a spreadsheet. spread_ABadd

The next step is to fill the addition formula down the column. Read more →

Blog recap of 2013

31 Dec 2013
2013/12/31

Posts by page views

  1. Interview with a forced convert to R from Matlab
  2. A first step towards R from spreadsheets
  3. Plot ranges of data in R
  4. A statistical review of ‘Thinking, Fast and Slow’ by Daniel Kahneman
  5. The 3 dots construct in R
  6. Translating between R and SQL: the basics
  7. An R debugging example
  8. R database interfaces
  9. R and social media
  10. On the acceptance of R
  11. The joy of data analysis
  12. The options mechanism in R
  13. A corner on convenient data analysis
  14. Living it up with computational errors
  15. Bricks not monoliths
  16. 100 savvy sites on statistics
  17. The AllTrials campaign

Views at other sites are not included — that is, views at R-bloggers and statsblogs.

This ordering gives an unfair advantage to posts that were written early in the year. Read more →

© Copyright - Burns Statistics